
Founder Charles Kirkland, Age 54 · The Origin Story
The Lab Timeline
In November 2025 I blacked out in my kitchen and was admitted at Atrium Health. Everything that followed was documented through third-party labs, on physician-prescribed medication and under ongoing physician supervision. This is the full timeline behind the numbers you see on the homepage.
The whole timeline in one table
Four markers, three points in time. Read across the rows rather than down the columns: the story here is that the numbers moved together, not that any one of them moved.
| Marker | November 2025 Atrium Health |
30-Day Follow-Up Luxor Scientific |
07/13/2026 Labcorp + Luxor |
|---|---|---|---|
| A1C | 7.2% | 6.5% | 5.7% |
| Triglycerides | 1,761 mg/dL | 163 mg/dL | 144 mg/dL |
| Blood pressure | 192/114 mmHg | 119/74 mmHg | — |
| Fasting glucose | — | — | 97 mg/dL |
| LDL | — | — | 88 mg/dL |
A dash means that marker is not part of the documented set published on this page, not that it was normal or abnormal.
I lost my mom
Two weeks before my own labs came back
This is where the timeline actually starts. I had spent 25 years helping build health and supplement brands while paying almost no attention to my own numbers. Losing her is what made me finally look.
Blackout, hospital admission, diagnosis
Atrium Health · diagnosed November 12, 2025
I blacked out in my kitchen and was admitted for evaluation. Until that week I had no diagnosis of metabolic syndrome. The initial labs came back:
- A1C: 7.2%
- Triglycerides: 1,761 mg/dL
- Blood pressure: 192/114 mmHg
My doctor described my blood as basically gravy. That was not a figure of speech for effect: a triglyceride level above 1,000 mg/dL carries real, immediate medical risk, including pancreatitis, which is part of why this was a hospital evaluation rather than a routine follow-up.
Taken together, these three numbers are not three separate problems. They are one body under significant metabolic strain, showing up in whichever marker happened to get measured.
Thirty days later
Luxor Scientific Laboratory · verified
Thirty days in, on physician-prescribed medication and under ongoing physician supervision, alongside structured lifestyle changes, the follow-up panel read:
- A1C: 7.2% → 6.5%
- Triglycerides: 1,761 → 163 mg/dL
- Blood pressure: 192/114 → 119/74 mmHg
This is the point where the framework that became The Four Loads started taking shape. What struck me was not any single number. It was that all of them moved in the same direction at the same time, which only makes sense if they were never four separate problems to begin with.
July 13, 2026
Labcorp + Luxor Scientific · most recent verified panel
Roughly eight months after the hospital admission, the most recent independently verified labs:
- A1C: 5.7%
- Triglycerides: 144 mg/dL
- Fasting glucose: 97 mg/dL
- LDL: 88 mg/dL
The thirty-day panel showed that the pattern could move. This one is about whether it holds. That is the part nobody photographs for a before-and-after: staying in range is its own ongoing work, still on medication, still under physician supervision, still measured rather than assumed.
What each of these numbers is actually telling you
Every marker on this page belongs to one of the four Loads. That mapping is what turned a scary lab report into something I could think about instead of just react to.
A1C and fasting glucose
How hard your body is working to handle the sugar and carbohydrate you eat, and how steady it stays between meals. A1C reflects roughly the previous three months rather than the morning of the draw.
Triglycerides and LDL
How your body is storing and moving energy. Triglycerides in particular respond quickly, which is why a number that high can fall substantially in a single month under medical care.
Blood pressure
The systems keeping you in balance day to day. One reading in an office is a limited snapshot, which is why the useful version is an average of several readings taken at home.
The thread running through all of it
Chronic low-grade inflammation rarely produces symptoms and is rarely tested unless you ask. It is less a fourth separate problem and more the thread connecting the other three.
Why they moved together
Insulin resistance promotes fat storage, and visceral fat worsens insulin resistance in return. Visceral fat produces inflammatory signaling molecules. Inflammation is associated with blood vessel function, which ties back to blood pressure. Pull on one and the others follow, in either direction. That mechanism is the entire reason this timeline reads the way it does, and it is what the Four Loads Framework exists to make visible.
The book is the long version of this page
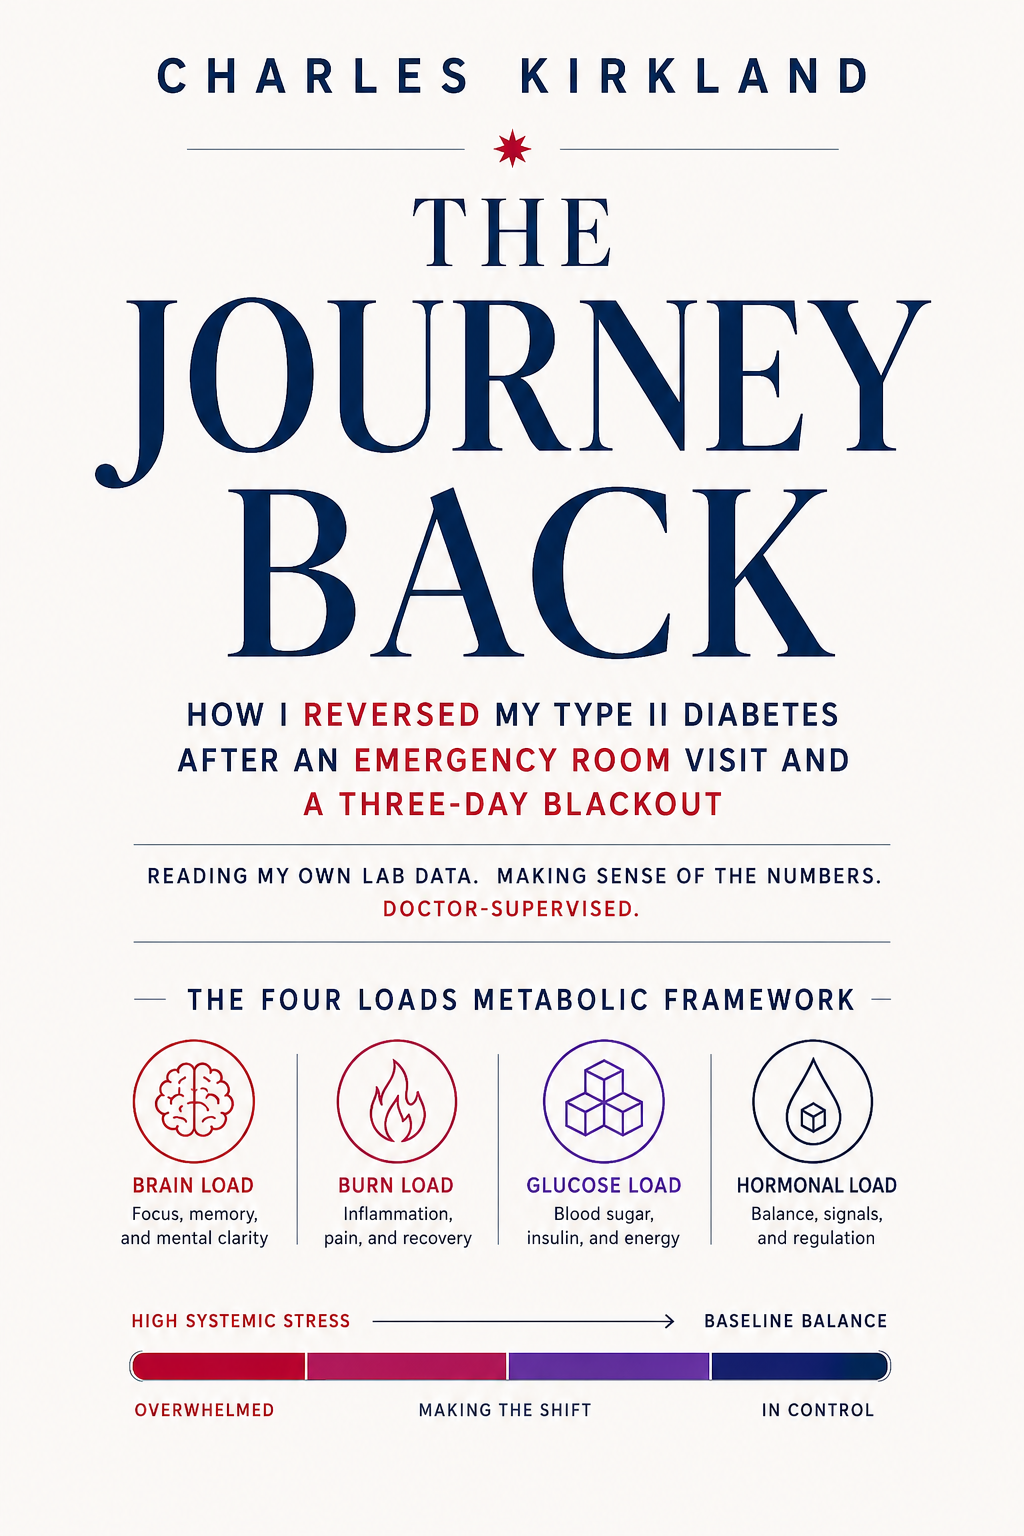
The Journey Back walks through the whole framework my doctor and I used to make sense of the bigger picture: Glucose Load, Storage Load, Regulatory Load, Inflammatory Load, and how they pull on each other. If you have looked at your own labs and thought, what does this actually mean, I wrote it for you.